A transistor is a semiconductor device used to amplify or switch electronic signals and power. It is composed of a semiconductor material, usually with at least three terminals to connect to the external circuit [wikipedia].
| | 
|
In [2]:
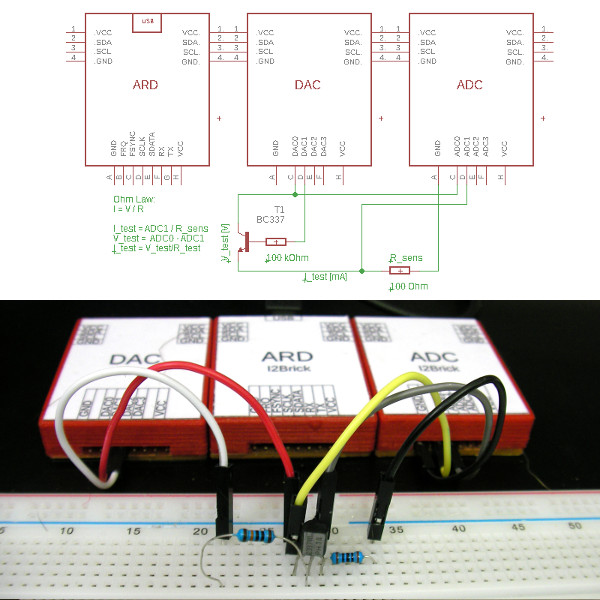
#Example Python code to demostrate ohm low.
from I2Brick import *
import matplotlib.pyplot as plt
%matplotlib inline
port = I2Brick('COM4') #Windows: Initialize serial communication with I2Bricks
#port = I2Brick('/dev/ttyUSB0') #Linux: Initialize serial communication with I2Bricks
print(ard(port)) #test communication between ARD and PC
R_sense=100
voltage5=[]
voltage10=[]
voltage15=[]
voltage20=[]
voltage25=[]
current5=[]
current10=[]
current15=[]
current20=[]
current25=[]
# I-V Curve for 5 microAmper
dac(port,1, 1320) #set dac voltage (for base current=5 microAmper)
for v in range (0, 4000,25):
dac(port,0, v) #set dac voltage
ADC0 = adc(port,0) #read adc0 voltage
ADC1 = adc(port,1)
if (ADC0<0 or ADC0>4096): ADC0 = 0
if (ADC1<0 or ADC1>4096): ADC1 = 0
voltage5.append((ADC0 - ADC1)/1000) #calculate voltage
current5.append(ADC1/R_sense) #calculate current
# I-V Curve for 10 microAmper
dac(port,1, 2015) #set dac voltage (for base current=10 microAmper)
for v in range (0, 4000,25):
dac(port,0, v) #set dac voltage
ADC0 = adc(port,0) #read adc0 voltage
ADC1 = adc(port,1)
if (ADC0<0 or ADC0>4096): ADC0 = 0
if (ADC1<0 or ADC1>4096): ADC1 = 0
voltage10.append((ADC0 - ADC1)/1000) #calculate voltage
current10.append(ADC1/R_sense) #calculate current
# I-V Curve for 15 microAmper
dac(port,1, 2715) #set dac voltage (for base current=15 microAmper)
for v in range (0, 4000,25):
dac(port,0, v) #set dac voltage
ADC0 = adc(port,0) #read adc0 voltage
ADC1 = adc(port,1)
if (ADC0<0 or ADC0>4096): ADC0 = 0
if (ADC1<0 or ADC1>4096): ADC1 = 0
voltage15.append((ADC0 - ADC1)/1000) #calculate voltage
current15.append(ADC1/R_sense) #calculate current
# I-V Curve for 20 microAmper
dac(port,1, 3415) #set dac voltage (for base current=20 microAmper)
for v in range (0, 4000,25):
dac(port,0, v) #set dac voltage
ADC0 = adc(port,0) #read adc0 voltage
ADC1 = adc(port,1)
if (ADC0<0 or ADC0>4096): ADC0 = 0
if (ADC1<0 or ADC1>4096): ADC1 = 0
voltage20.append((ADC0 - ADC1)/1000) #calculate voltage
current20.append(ADC1/R_sense) #calculate current
# I-V Curve for 25 microAmper
dac(port,1, 4095) #set dac voltage (for base current=25 microAmper)
for v in range (0, 4000,25):
dac(port,0, v) #set dac voltage
ADC0 = adc(port,0) #read adc0 voltage
ADC1 = adc(port,1)
if (ADC0<0 or ADC0>4096): ADC0 = 0
if (ADC1<0 or ADC1>4096): ADC1 = 0
voltage25.append((ADC0 - ADC1)/1000) #calculate voltage
current25.append(ADC1/R_sense) #calculate current
dac(port,0, 0)
dac(port,1, 0)
port.close()
plt.plot(voltage25, current25,label='25 microamper')
plt.plot(voltage20, current20,label='20 microamper')
plt.plot(voltage15, current15,label='15 microamper')
plt.plot(voltage10, current10,label='10 microamper')
plt.plot(voltage5, current5,label='5 microamper')
plt.axis([0,5,0,10])
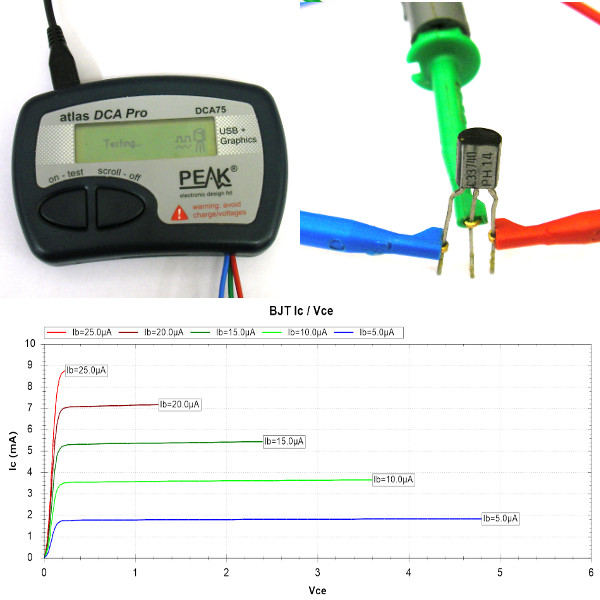
plt.title('i-v curve for BC337')
plt.legend()
plt.xlabel('Voltage [V]')
plt.ylabel('Current [mA]')
plt.show()

Advanced Semiconductor Analyser For comparison, the BC337 transistor was also tested with a Peak Electronics Atlas DCA75 Pro Advanced Semiconductor Analyser (right).
| | 
|